
JPRO’s guided diagnostics and troubleshooting features are designed to help technicians efficiently identify and resolve vehicle faults. These tools are especially useful when one or more active fault codes are present, guiding users step-by-step instead of relying on manual diagnostic processes.
Repair Mentor: Your Starting Point
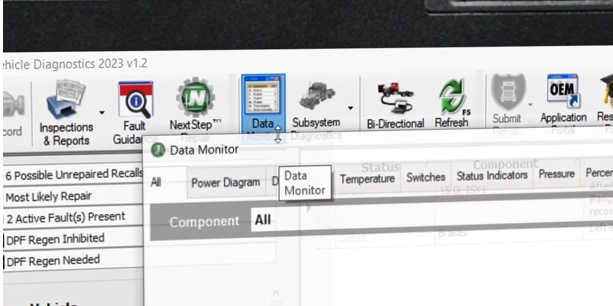
The first tool to become familiar with is Repair Mentor. When JPRO connects to a vehicle and detects active faults, Repair Mentor will automatically appear—unless it’s been disabled in the software preferences. If it doesn’t pop up, you can access it manually by clicking the Repair Mentor button in the upper-left corner of the screen.
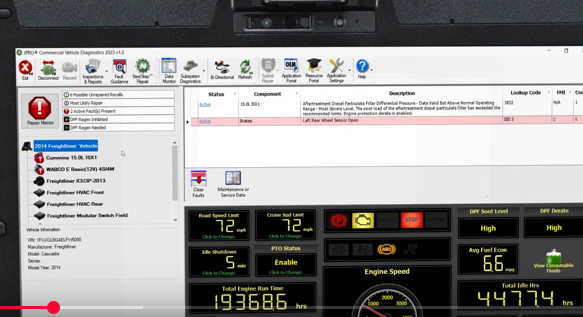
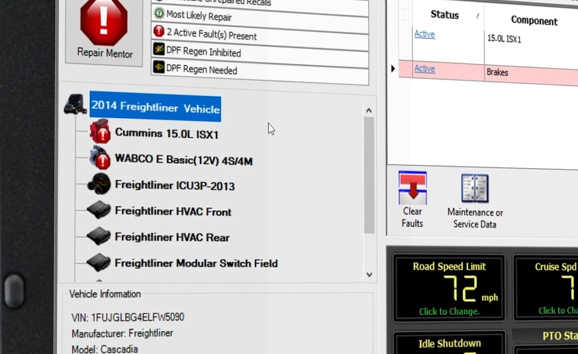
Repair Mentor helps prioritize faults and provides clear, guided steps for diagnosing and resolving issues. When you open it, you’ll typically be prompted to begin diagnostics with the most critical fault—such as an active engine fault. Click Begin Diagnostics to launch the appropriate module, which usually leads you to Fault Guidance.
Fault Guidance: Step-by-Step Troubleshooting
Fault Guidance is a key feature in JPRO that offers detailed troubleshooting support. Here’s how to navigate it:
Fault Codes: Displayed at the bottom of the screen, each code corresponds to a
Bi-Directional Tests: Certain diagnostics may require active testing—such as an ACM reset before performing a forced regen. These tests can be launched directly from Fault Guidance.
Clear Faults Button: Located above the Bi-Directional Tests section, this button is used at the end of a repair to clear fault codes that have gone from active to inactive.
Additional Tools in Fault Guidance
OEM Applications: Found under the Additional Resources section, this button launches manufacturer-specific diagnostic tools installed on the computer. It’s ideal for experienced users needing deeper system access.
Industry Terms: Also under Additional Resources, this dictionary explains industry-specific acronyms and terms, helping users unfamiliar with the language.
Navigating Tabs in Fault Guidance
The top of the Fault Guidance screen features several tabs, which vary depending on the fault:
Overview Tab: Provides a high-level summary of the fault and affected systems.
Wiring Tab: Includes detailed diagrams and step-by-step instructions for locating specific wires or connectors. Use the zoom controls in the upper-left corner to view details.
Troubleshooting Tab: Lists components to inspect or test—both physically and electrically. You’ll follow prompts (YES/NO) to guide your next steps. For example:
Visual inspections might involve checking connectors for corrosion or loose cables.
Electrical checks might involve using a volt-ohm meter, which displays actual vs. expected voltage ranges.
Final Steps and Additional Features
Verify the Repair: Some faults include a final step to confirm the repair by clearing the code and checking if it reoccurs.
Locator Tab: Appears for certain faults and shows detailed photos or diagrams to help you find specific components, like sensors.
Maintenance / Service Data: Found on the right-side toolbar, this button opens OE service manuals. While Fault Guidance often contains the same information, experienced technicians may prefer using these manuals directly.
Vehicle Faults vs. Vehicle Values
At the bottom toolbar, you can toggle between Vehicle Faults and Vehicle Values:
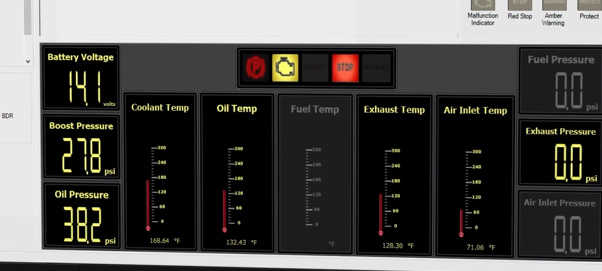
Vehicle Values display real-time data points, such as resistance or voltage.
This feature can be used to quickly reference measurements during troubleshooting, saving time compared to manual testing. For instance, if a step asks whether resistance between two wires exceeds 50 ohms, the value may already be shown on-screen.
With these tools, JPRO simplifies and accelerates the process of diagnosing and repairing vehicle faults. Whether you’re just getting started or a seasoned tech, its guided workflow helps ensure accurate and efficient repairs.