
In this article I’m going to talk about how you can recode some of the outputs on the instrument cluster in particular by Porsche Piwis3, today I’m going to talk about the coolant temperature output that you see in instrument cluster, as well as the speed and the reason you may want to do this is because at the moment, the indication that you get is filtered so, for example, most of the speedo indications are reduced slightly. So, for example, if you are doing uh 80 kilometers an hour, it’ll show you as doing 82 kilometers an hour uh. That sort of thing- and so if you want to see exactly what’s going on, like the actual coolant temperature rather than being filtered and just sticking it 90 the whole time.
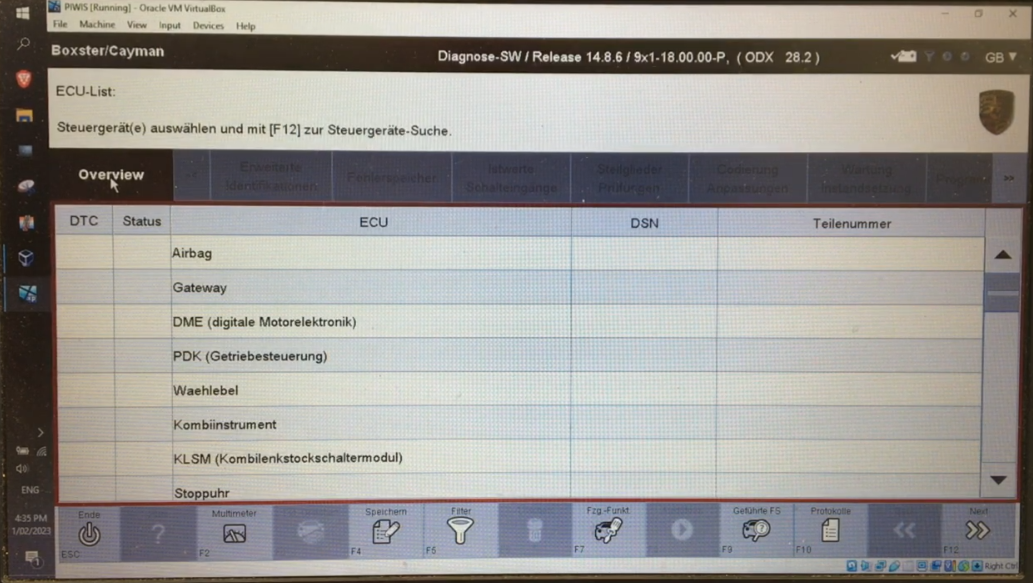
This is the way to do it, so you need to be in p-wish development mode. If you don’t know how to do that, have a look at the other videos that I’ve made on how to code and peel so it’ll show you how to do that. And then this is all in german. So google translate might be your friend if required, but I’ll show you how to do these and which options to go to when we firstly get a combi instrument, and then this one here, codering s and passion or whatever it is which is just coding.
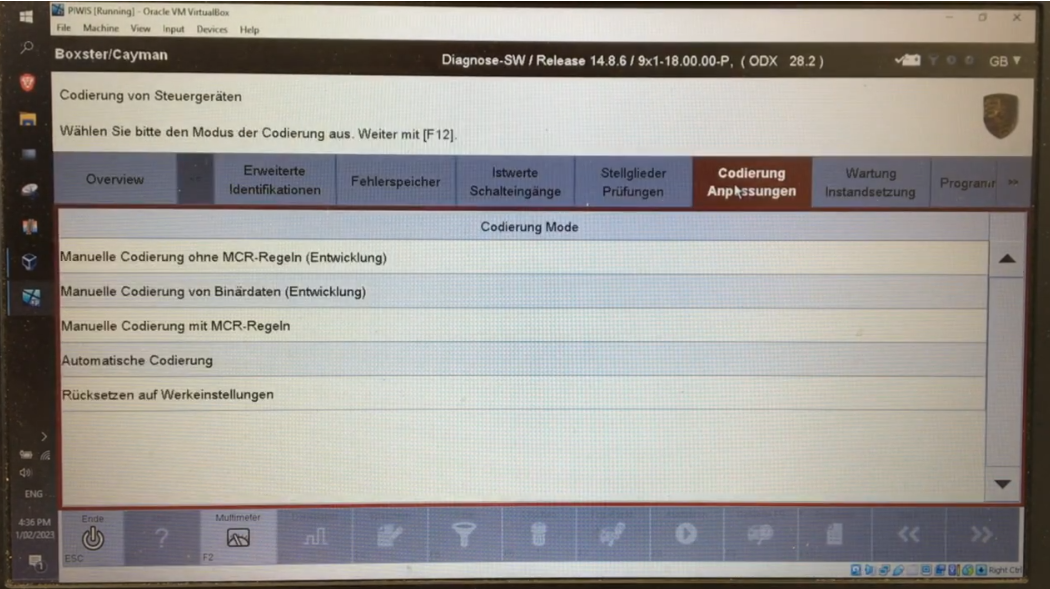
And then we want to go to the top one there, which is manual coding on mcr reglan, which is without mcr rules. Next, and this will list, there are just reams and rooms and rooms of these things and down the bottom here. There’s lots of, for example, you can remove different warnings that pop up or make sure they pop up that sort of thing. But what we’re going to look at today to start off with, is come down to this one here. This cool vasa temperature, which is basically translates to cooling water temperature, hopefully you’re cooling and the way this works sit there. If you think about it, there’s a graph with an x and a y axis we’ve got x and y options here and the x is the input temperature from the dme, which is the actual temperature and y, is the output it can grab all of these and what we’re going to do is change the y outputs to equally acceptable. So, let’s just rattle off all of these there, so I’ve selected all of those. Let’s go next. So once you open this up, what you’ll notice is there are eight values for the x, which is the actual input temperature and there are going to be eight values for y, which are the actual output temperatures that you would see now. I’ve changed all of these. So the x’s are the same as the y. So basically, all I did was I looked at all the x’s here, so the input, temperatures and I made the y’s equal to those and I’ll just change one here just so, you can see what’s going on the temperature.
Just so can still have a bit of a play with it. The temperature at the moment is 42 degrees celsius. So it’s obviously in between these wire graphs here. What I’m going to do is change this to 20. So show you what you do you click in another area and then I’m going to go down here if they scribbon, which is save and if I now go to the temperature in the instrument cluster because it happens, live that’s immediately, changed to 31 degrees from the 42 that it was so now. What I want to do is go back and change that back to 36. So that’s correct and then it’ll show me the correct temperature in the instrument cluster. Now, if I look at the instrument cluster, it’s gone back to 41 degrees again, so hopefully that makes sense of what you’re trying to do just make all the wires equally excess.
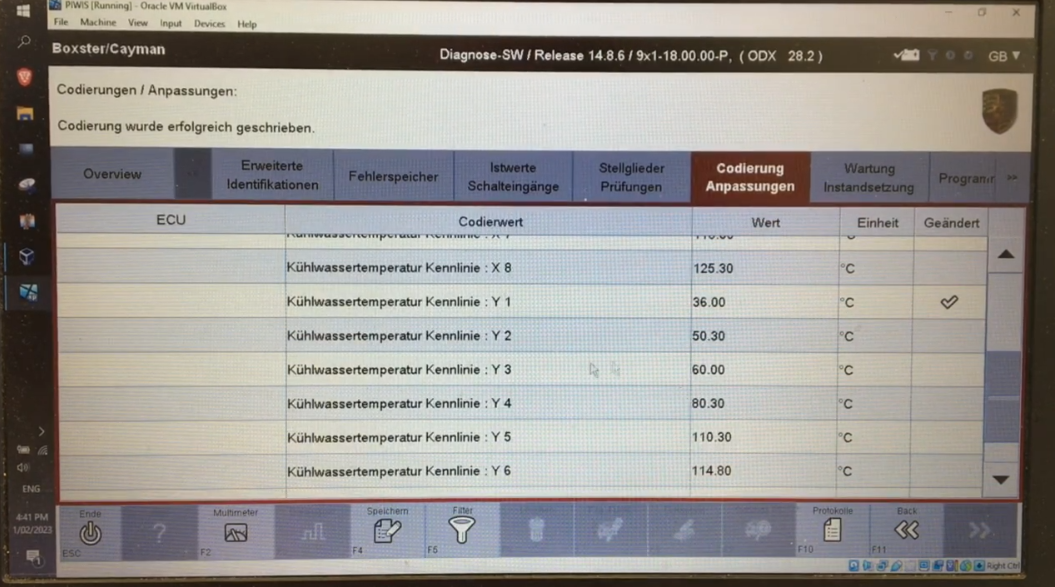
Now I suspect that you could quite happily just go along and just make these sensible temperatures make that 0 30 60 90 and just make all the others exactly the same, and it would have exactly the same effect, but all I’ve done there is just obviously make the y’s equal, the x’s and all of those other options, if you scroll down you’ll, find this one here, taco or whatever. That is, and there are a bunch of options here. You can see that we’ve got that word there, which actually means speedometer rdw, which I think means the rest of the world and if I continue to scroll down, you can see. I’ve got x’s and y’s for rest of the world. Then I’ve got a uk option and a usa option and what they do is they make corrections to the speedometer. So, for example, if you’re doing 100 kilometers an hour, I think I’d say display 102 kilometers now now I went and changed all of them for rdw, uk and us so they’re all exactly the same. So x equals y for all. All of those but I suspect that comes down to the uh country, variant because they’re all slightly different, so, for example, in usa what the actual speed was in the output was exactly the same, all the way to the point of going really really fast like well.
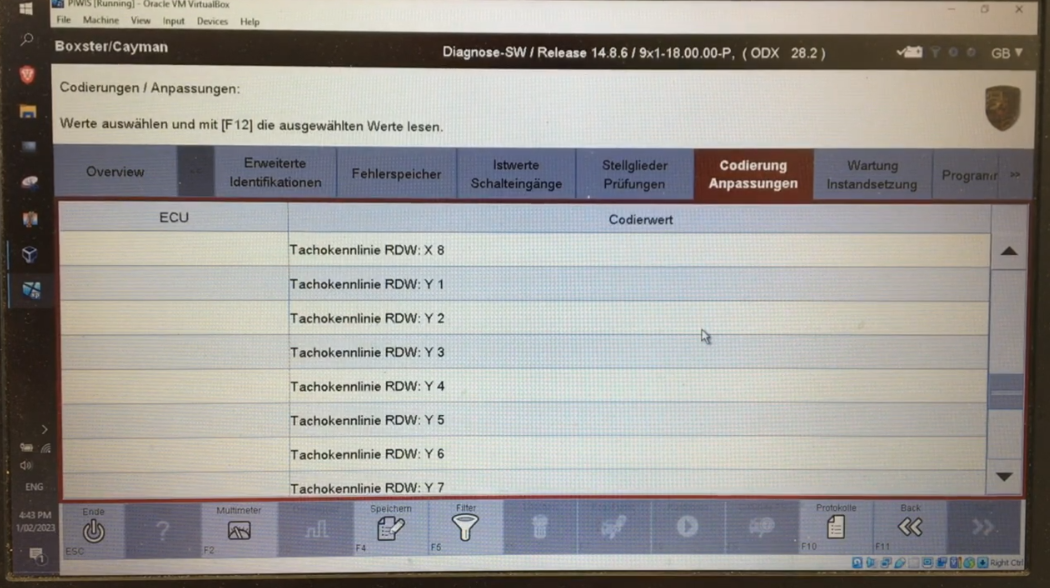
Above 300 kilometers an hour uh, but all the others were the same, whereas for the rest of the world they over read by about so I wanted to make those I know from my speedo just driving around and using a handheld gps that it does overeat. By about two percent, so I’ve changed it, and now it reads correctly. So what I’m going to do is just go in here again, let’s go and select all of these, so these are all the inputs and outputs for the rest of the world, maybe in australia I’m in the rest of the world. So as you can so what I did on my other car that I drive every day, I just made all of the volt y values down here: equal those x values, save those, and then it read perfectly okay, some other options that are available in here. For example, the geforce indicator, the actual inputs and outputs are not linear. So if you want to change that, there’s the same sort of thing, there are eight options for x inputs and y outputs that if you wanted to change that, you can also change the response from the fuel gauge. If you want not that you really need to do that, but for mine, one of the nice things you can see how much fuel is actually in the car at the different indications. So you can see, for example, at empty. It’s going to show zero liters when the reserve light comes on it’s 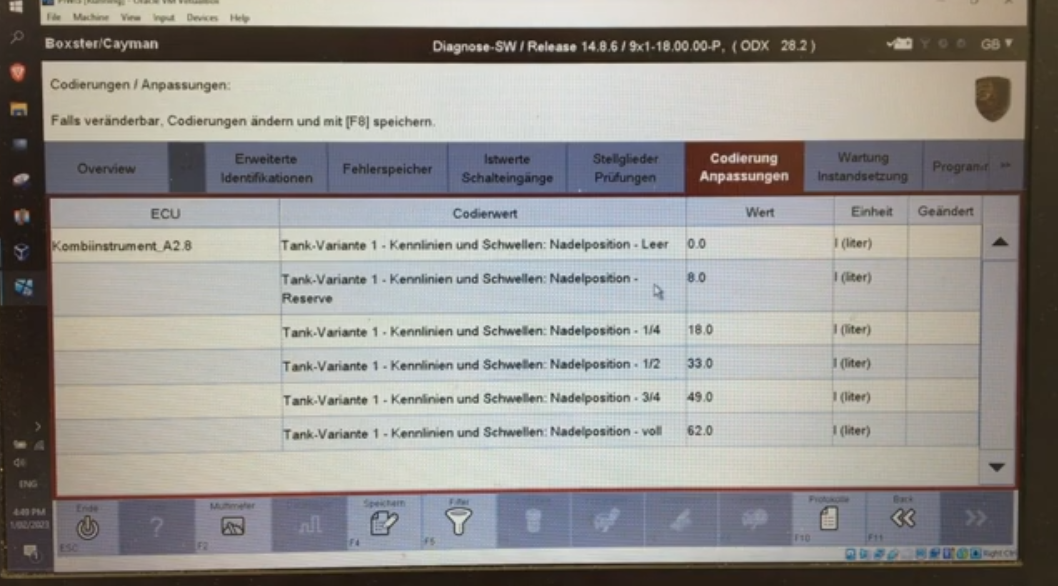
You know, you’ve got eight liters left, 18 liters at a quarter, 33 and a half 49 and three quarters and four is 62 liters and what’s interesting, that that just shows me at least I know when this light comes on, for example, or a quarter of a tank, how much is actually in the the tank- and it shows me that it’s not linear, they will tell you that you’ve got less in it as it starts to get low than you actually have another option. That’s available to you is the bar graph, so you can see that’s funny because in this one here, cool middle is actually coolant, so instead of cooling water, they call it coolant in this case, but the two bar graphs for coolant and oil temperature. You can adjust when or the when it starts to indicate at when it first starts to move off the the stops and where the end is and also where the red zone is as well. So you can see that, for the coolant starts to come off the stops at 60 degrees, the end of the graph is 155 and the red is 123.
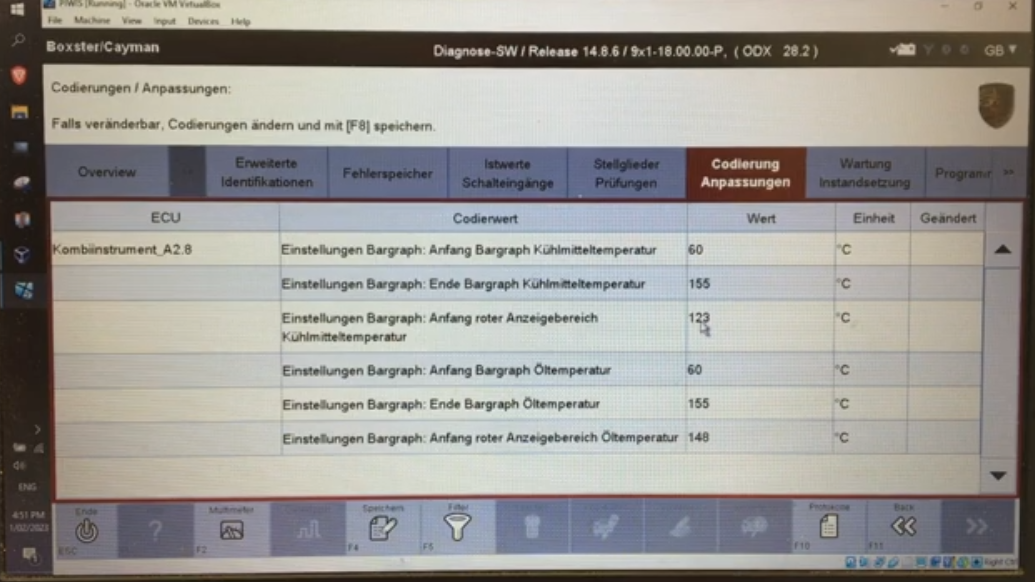
And the oil temperature starts at 60 ends at 155 and the red oil temperature is 148, so you can adjust those if you want to.